When you've created a website using one of our web hosting packages, you can view your website's statistics in the TransIP control panel.
This article shows you how to enable the statistics and how to read them.
Enabling the website statistics
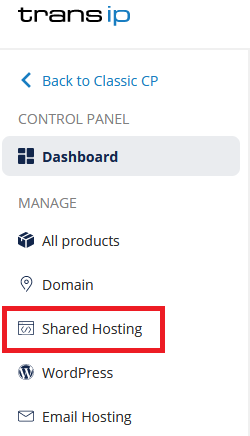
Log in to the control panel and click 'Shared Hosting' in the menu. Next, select your domain below 'Products'.

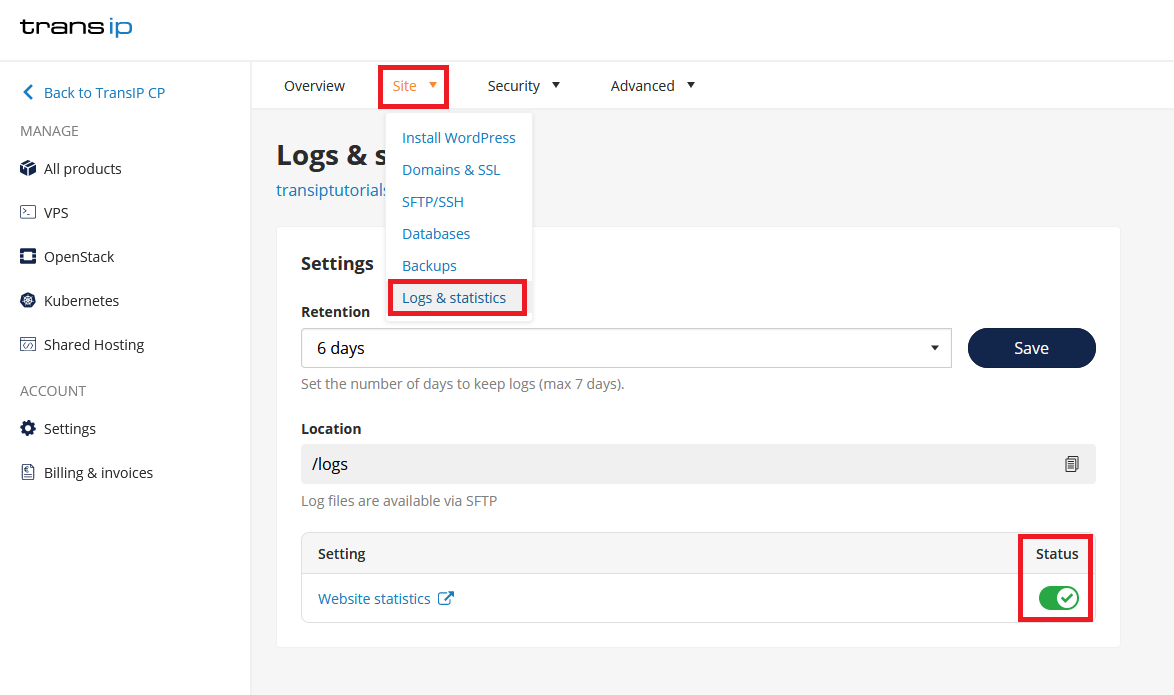
Click 'Site' at the top of the screen and select 'Logs & statistics'.

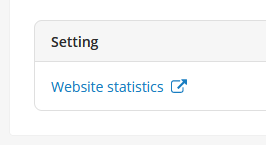
At the bottom of the page you will find the option 'Website statistics' with the current status on the right. You can change the status by clicking the sliding button.
- Green means the website statistics are enabled.
- Gray means the website statistics are disabled.
After enabling, it can take up to 24 hours until the statistics are available in AWStats. After this you can view your statistics by clicking 'Website statistics'.

The website statistics
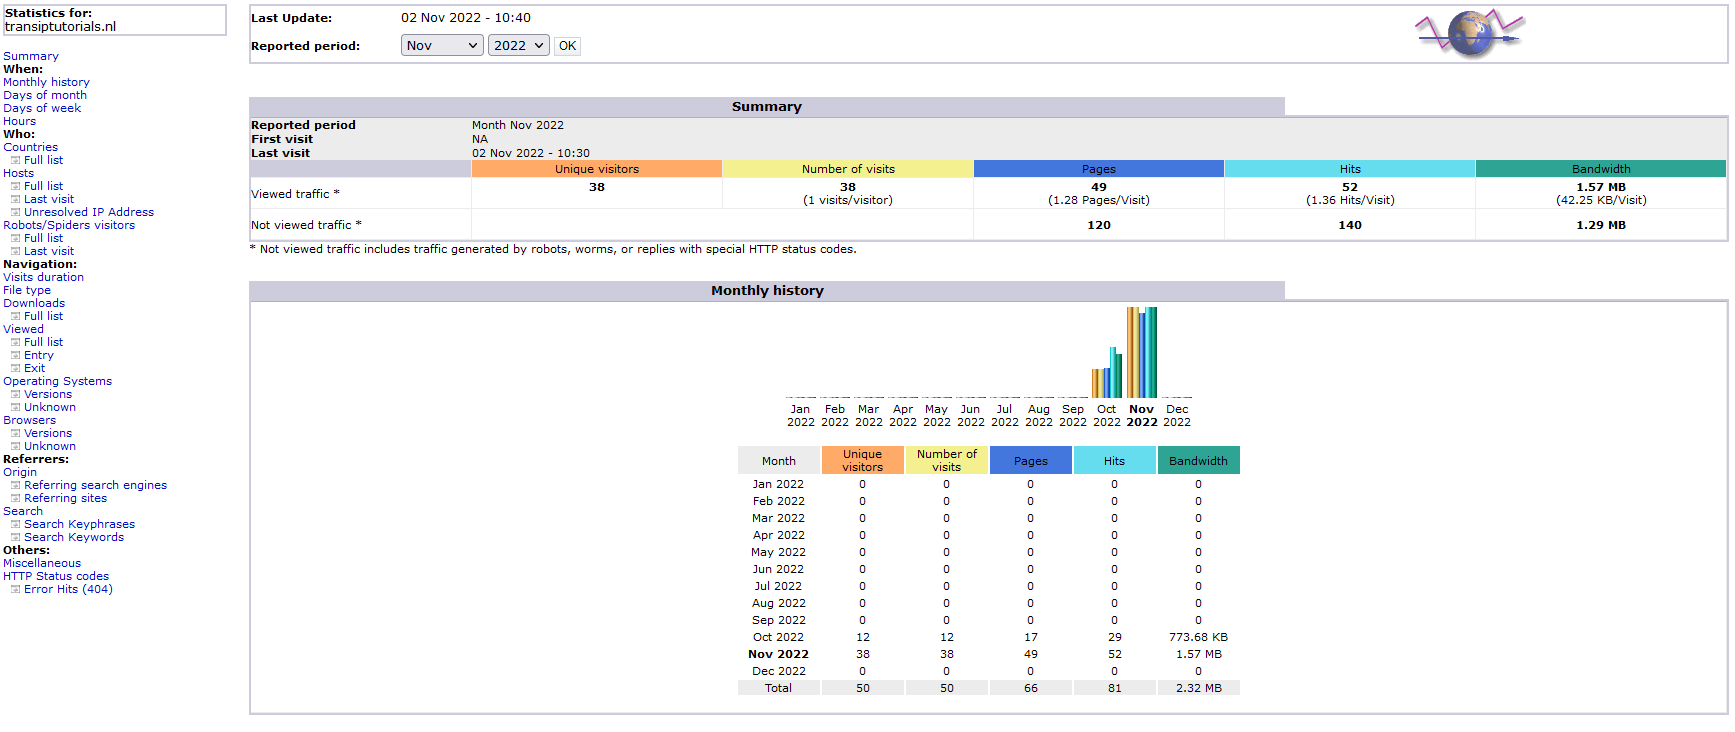
As described above, you can view your website's statistics by clicking 'Website statistics'. An example of what this looks like can be found below.

The statistics are created with AWStats. This is a tool that provides insight into the traffic to your website. The colours in the tables and bar charts each represent a way in which your website was visited.
The meaning of each colour is as follows:
These statistics show the general traffic to and from your website. If you wish to view more detailed information, we recommend using Google Analytics on your website.
This article showed you how to view and read the statistics of your website as provided in your control panel.


