


Grafana is an open-source monitoring and analytics platform for Kubernetes that allows you to query metrics (such as hardware usage), visualize them easily, and send alerts, for example from Prometheus.
In this tutorial, we will show you how to install Grafana on your Kubernetes cluster.
For the steps in this tutorial, you will need:
Installing Grafana
Step 1
Create a new namespace for Grafana:
kubectl create ns grafana
Step 2
Add the official Grafana Helm repository to your cluster:
helm repo add grafana https://grafana.github.io/helm-charts
helm repo update
Step 3
Next, install Grafana in the Grafana namespace using the command:
helm install grafana grafana/grafana --namespace grafana
- helm install installs the chart
- grafana (the first mention) is the name we give to the Helm 'release,' and you are free to change it
- grafana/grafana is the repository and chart being installed
- --namespace grafana installs the Helm release in the Grafana namespace
- optionally, you can use your own values.yaml file to make changes and refer to it during installation using the addition -f values.yaml (see our documentation on editing Helm charts for installation for more options)
You will see an output similar to the following:
NAME: grafana
LAST DEPLOYED: Mon Jun 12 14:37:52 2023
NAMESPACE: grafana
STATUS: deployed
REVISION: 1
NOTES:
1. Get your 'admin' user password by running:

   kubectl get secret --namespace grafana grafana -o jsonpath="{.data.admin-password}" | base64 --decode ; echo


2. The Grafana server can be accessed via port 80 on the following DNS name from within your cluster:

   grafana.grafana.svc.cluster.local

   Get the Grafana URL to visit by running these commands in the same shell:
     export POD_NAME=$(kubectl get pods --namespace grafana -l "app.kubernetes.io/name=grafana,app.kubernetes.io/instance=grafana" -o jsonpath="{.items[0].metadata.name}")
     kubectl --namespace grafana port-forward $POD_NAME 3000

3. Login with the password from step 1 and the username: admin
#################################################################################
######   WARNING: Persistence is disabled!!! You will lose your data when   #####
######            the Grafana pod is terminated.                            #####
#################################################################################
With that, the installation of Grafana is complete! We will cover the information you see in the output above in the next paragraph.
You can retrieve information about your Helm release using the following command:
helm list -n grafana
Using Grafana
Step 1
First things first. After installing Grafana, you saw in the output under note 2 that you can host Grafana locally. However, for this guide, we assume that you also want to use Grafana remotely by using a (sub)domain. If not, proceed to step 3.
In order to use Grafana via a subdomain, it is important to first install an Nginx Ingress Controller on your Kubernetes cluster. Use our Nginx Ingress guide for this and add a subdomain for Grafana in step 5, for example grafana.example.com, and point it to the IP address of the load balancer as explained in the guide.
Step 2
Of course, you want to secure your Grafana website as well. Therefore, also install Cert-Manager as described in our Cert-Manager tutorial and generate a Let's Encrypt certificate. The section 'Using Cert-Manager' provides an example of this for Grafana.
Note that you should use the (sub)domain from step 1 of this section and not the subdomain.example.com used in the example.
Step 3
In the output of the Grafana installation command, you saw a command to retrieve the password for the admin user. Now, retrieve it using the provided command:
kubectl get secret --namespace grafana grafana -o jsonpath="{.data.admin-password}" | base64 --decode ; echo
Step 4
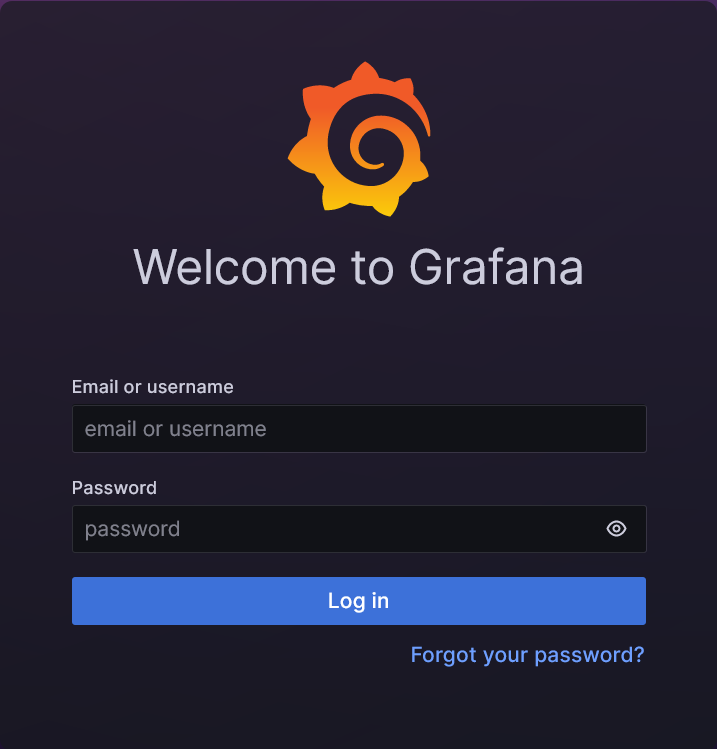
By now, enough time has likely passed for the Let's Encrypt certificate to be associated with your Grafana (sub)domain. Go to the corresponding (sub)domain in your browser. You will see the login page below. Log in with the username 'admin' and the password obtained in step 3.
Step 5
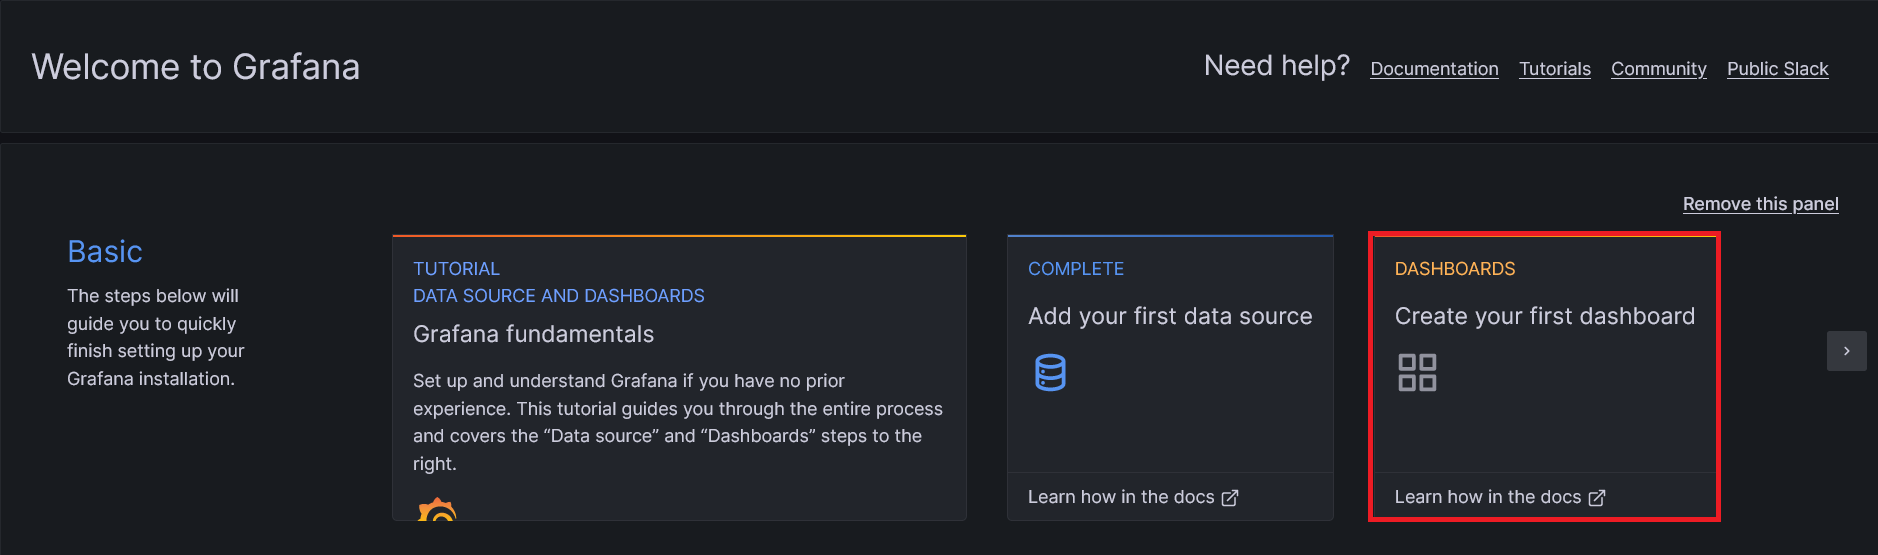
You are greeted by the screen below. As the first step, you will add a 'Data Source,' which is the source from which Grafana fetches and visualizes its data.
Click on 'Data Sources'.

Step 6
Grafana supports many data sources, but for this guide, we will use Prometheus. Click on 'Prometheus' to continue.

Step 7
For visualization, let's first show you how to easily visualize a data source on your own. From step 9 onwards, we will demonstrate how to import a dashboard from a large database of ready-to-use dashboards.
Go back to the home screen and this time select 'Dashboards'.
Step 8
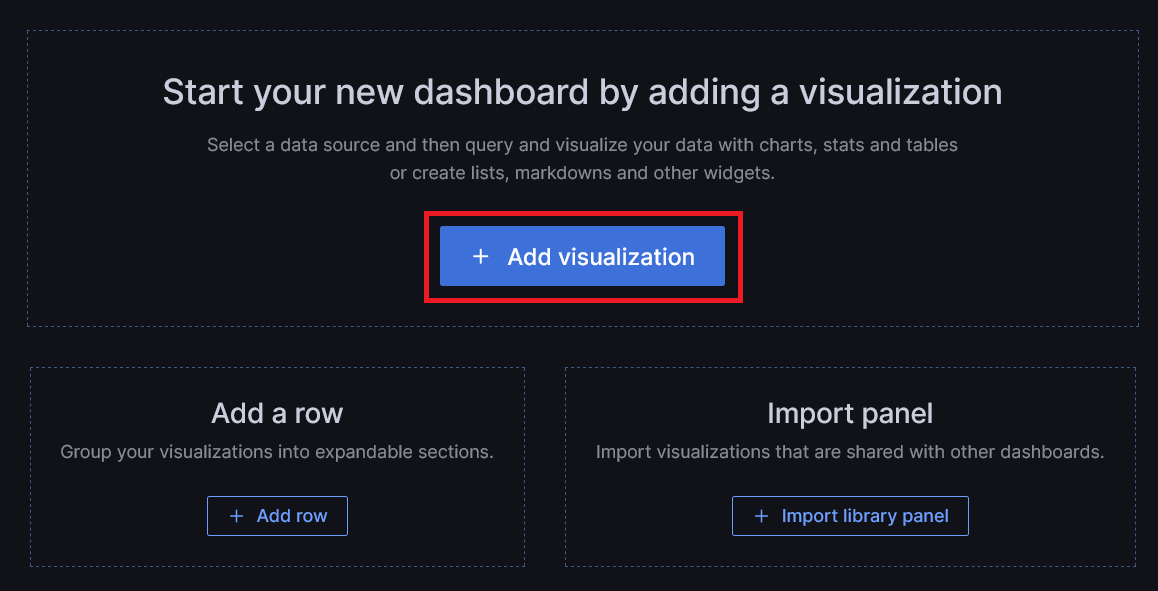
Click on 'Add visualization'.
Step 9
If you are not using any other data sources, Prometheus should be selected by default. Take a look at 'Select metric' (bottom left) to get an idea of the many available options. For this guide, we will create a simple overview of the CPU usage of your Kubernetes cluster.

- Click on 'Code' (1) to specify a PromQL query (the query language used by Prometheus).
- Enter the following command (2):
100 - (avg by (instance) (irate(node_cpu_seconds_total{mode="idle"}[5m])) * 100) - Give your dashboard a title (4).
- Adjust the other available options under 'Panel options' as desired (3).
- Finally, click on 'Save' in the top right corner (5)
Step 10
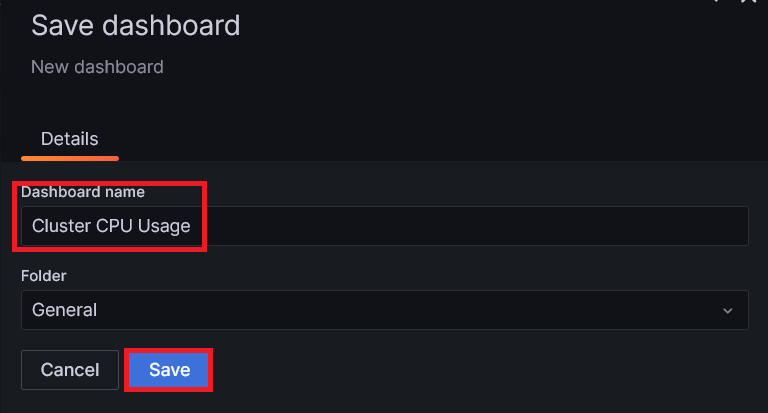
Give your dashboard a name and optionally adjust the folder (you can also do this later). Then, click on 'Save'.
Congratulations! You have created your first dashboard to monitor the CPU usage of your cluster.
Step 11
Another useful feature in Grafana is the ability to use existing dashboards. You can find them on the website https://grafana.com/grafana/dashboards/. One fairly comprehensive example is the Kube state metrics dashboard.
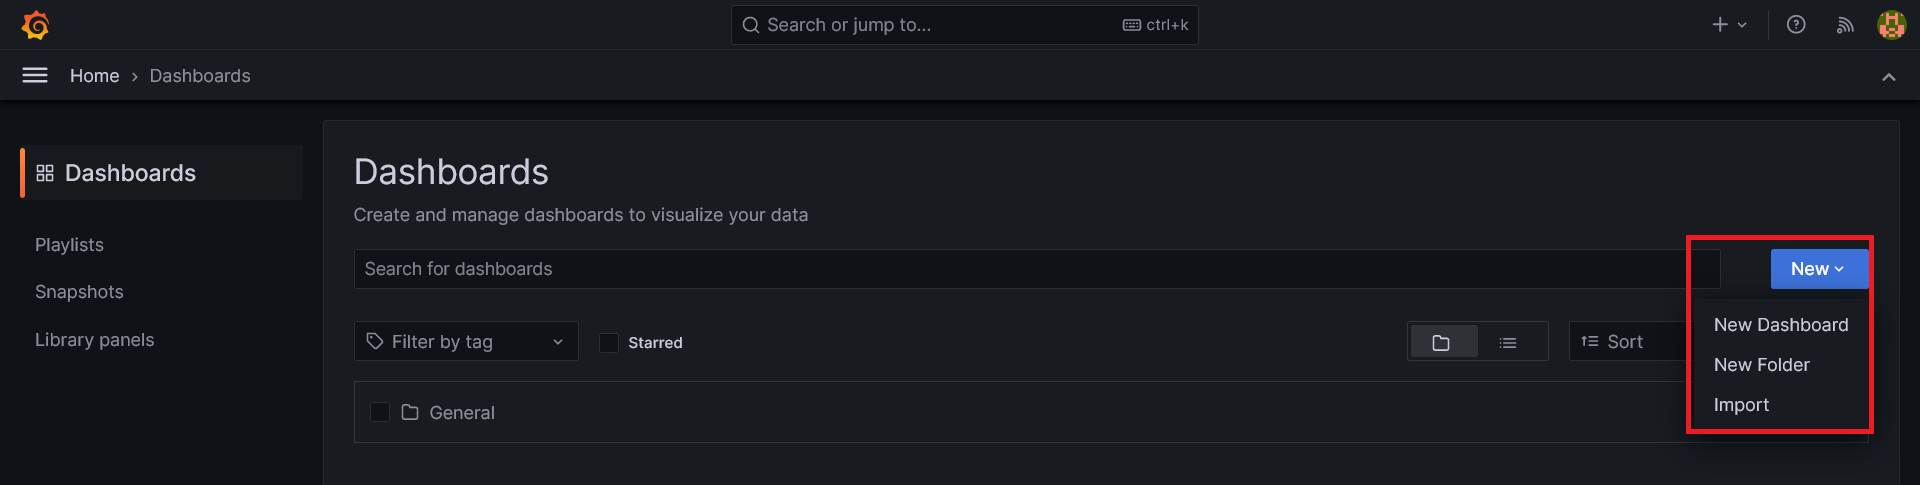
Go back to the dashboard overview under 'Home' > 'Dashboards' and click on 'New' > 'Import'.
Step 12
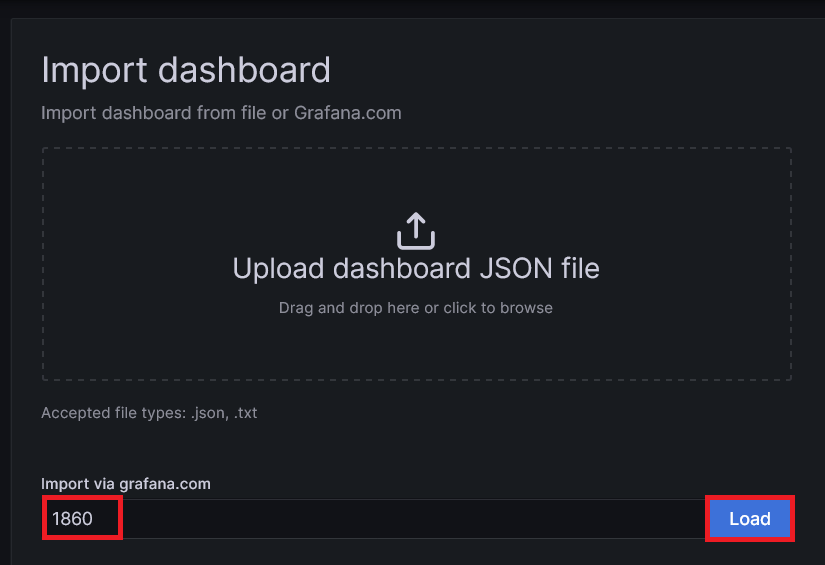
Enter the Dashboard ID of the dashboard you want to import and click 'Load'.
On the website with the overview of Grafana dashboards from the previous step, you will find a button to copy the ID for each dashboard.
Step 13
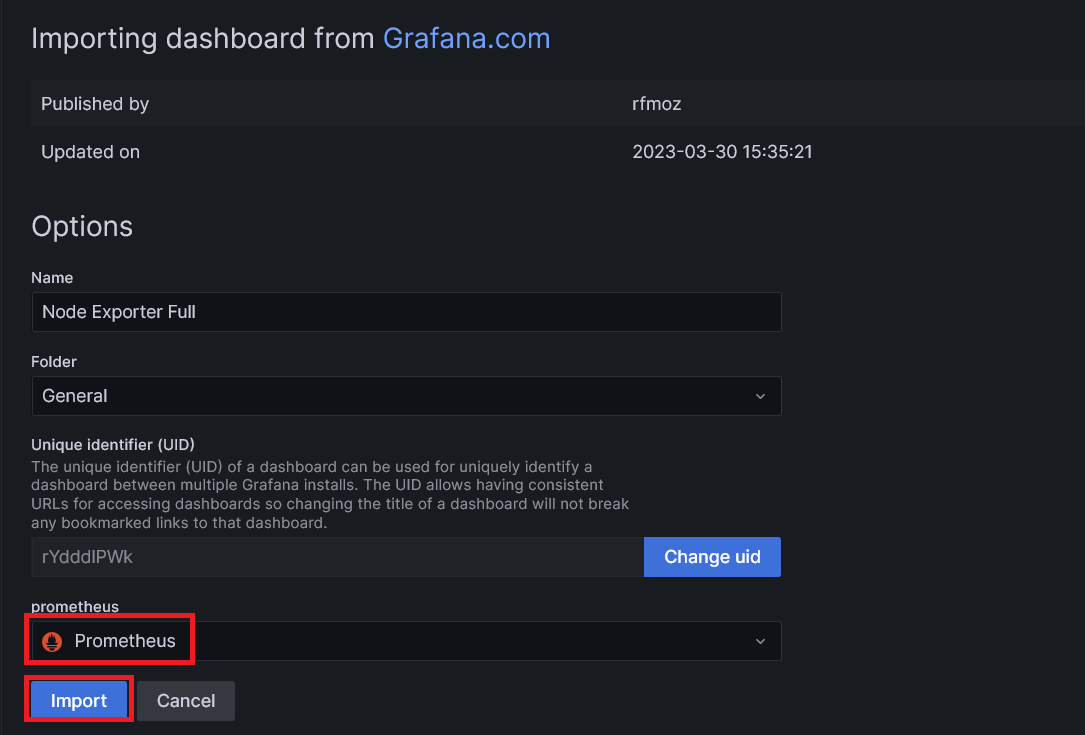
Select 'Prometheus' as the data source and click 'Import'. You will now be taken to your new dashboard!
This concludes our Grafana guide. For further exploration of its capabilities, we recommend checking out the Grafana documentation.